Within Futrli Advisor's Forecasting section you can view, create and edit forecasts that have been created for any organization you have access to. In this guide, you'll find an overview of the forecasting feature!
- - - - - -
Forecast information
Within the top left of your forecast, you'll find the name, length and the date range of your forecast displayed. In the top right, your forecast's view options, including the start date that data will display from and the reporting period (weekly, monthly, quarterly or annually):

- - - - - -
Forecast name
You can change the name of your forecast at any time. To do so, select the currently displayed name by clicking it. This will allow you to edit it as you wish. Simply enter your desired amendments before clicking the tick to save your changes.
- - - - - -
Forecast date range
The length and bounds of your forecast can be seen displayed in the top left of your selected forecast. The length and bounds of a forecast can be changed using the forecasting method as explained in this help guide.
- - - - - -
Report start date
In the top right of the window, you'll see which period the current view you have is starting from:

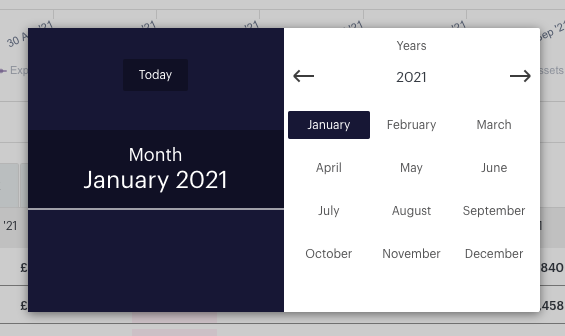
This is the date which dictates when information displays from. For example, if January 2021 is selected, we'll find that data displays from January 2021 onwards. You can change the start date at any time. To do so, click the calendar icon, a new window will display containing all selectable start dates. The currently selected start date will be highlighted in pink. You can select a new start date by clicking it:
- - - - - -
Reporting period
Your forecast data will display in accordance with your selected reporting period. This can be seen displayed in the top right of your forecast and can be changed between daily, weekly, monthly or quarterly by hitting the drop down:

If you wanted to export a larger time frame than the current view, you can do so using a card on a board. This help guide can give you information on this!
- - - - - -
Forecast layout
The order in which account categories and formulas display within the 'Workings' tab of your scenario will be dictated by your selected layout. You can view your layout by clicking 'Edit Layout' on the forecast control panel. All items will display in order based upon where they have been placed in the layout. To edit your layout, click 'Edit Layout':

- - - - - -
Reordering items
You can reorder where items appear within your layout by dragging and dropping them into a new location:
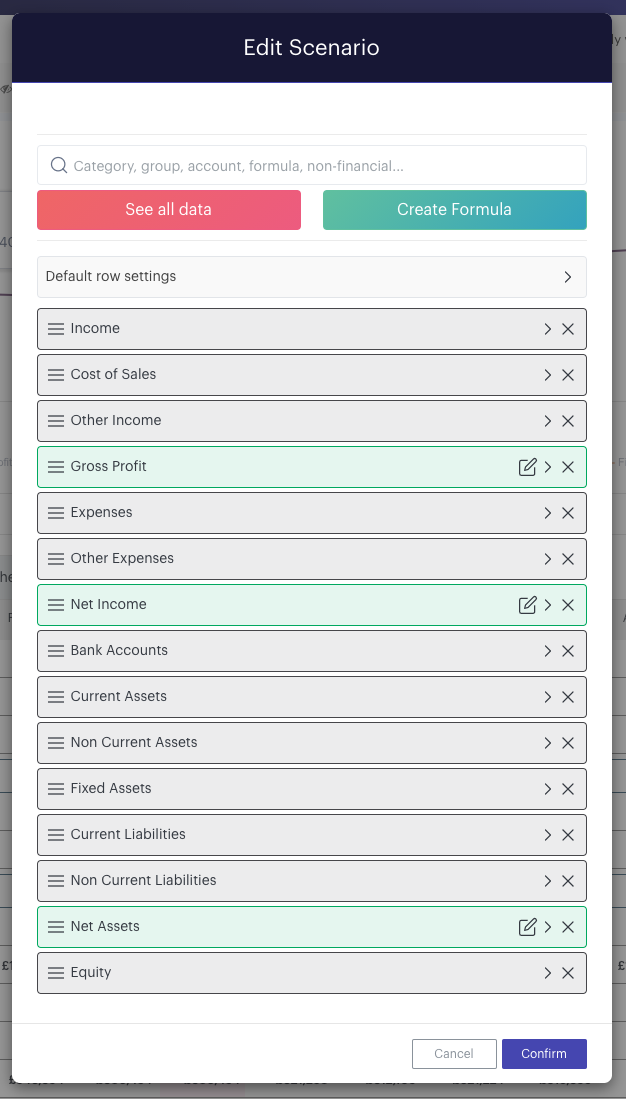
To save changes click 'Confirm'.
- - - - - -
Adding/removing items from the layout
Removing a row
To remove an Item from the layout click the x that appears adjacent to the line within the 'Edit Layout' window. Clicking the x will remove the item from the layout.
Adding an account
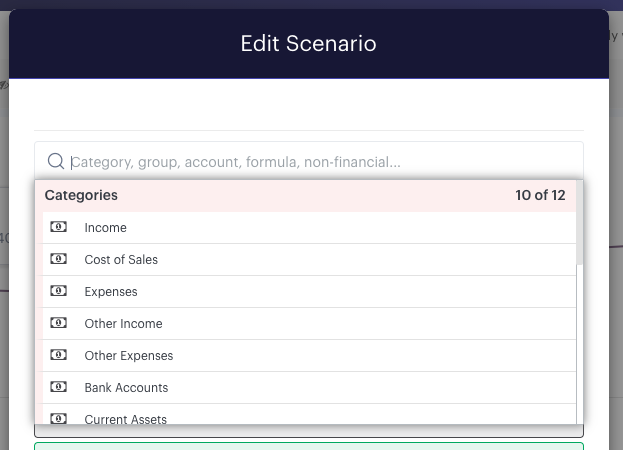
You can add an account category to your layout by searching in the search box, then selecting the item you'd like to add:
Adding a formula
You can add formulas to your layout using the 'Create Formula' button:
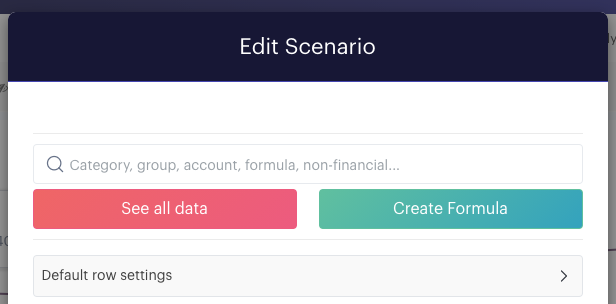
You can add a saved formula from your formula library, or create a new one from scratch by clicking' Formula Builder'.
- - - - - -
Hiding/showing items with zero values
Within your forecast, you can choose to hide or show accounts, formulas, groups or forecast items which contain zero values for your selected reporting period. To do so, click the 'Hide/show rows' button in the control panel of your forecast, then check or uncheck items you wish to hide with zero values:

- - - - - -
Interacting with data
Drilling into transactional movements
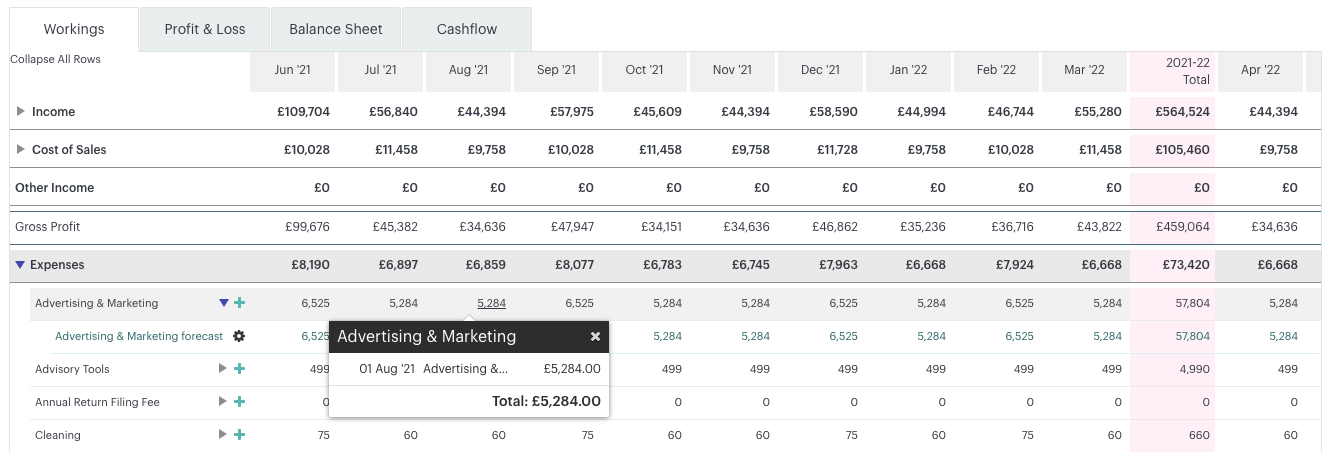
You can drill into each Account line to see the detail of your forecasted transactional movements within a period. To do so, click the period value for an account line. In the example below we've clicked the period value for 'Advertising & Marketing' for August 2021. This reveals the transactional movements which we've forecasted. Any credits or debits will be listed here chronologically by data:
Using the forecast chart
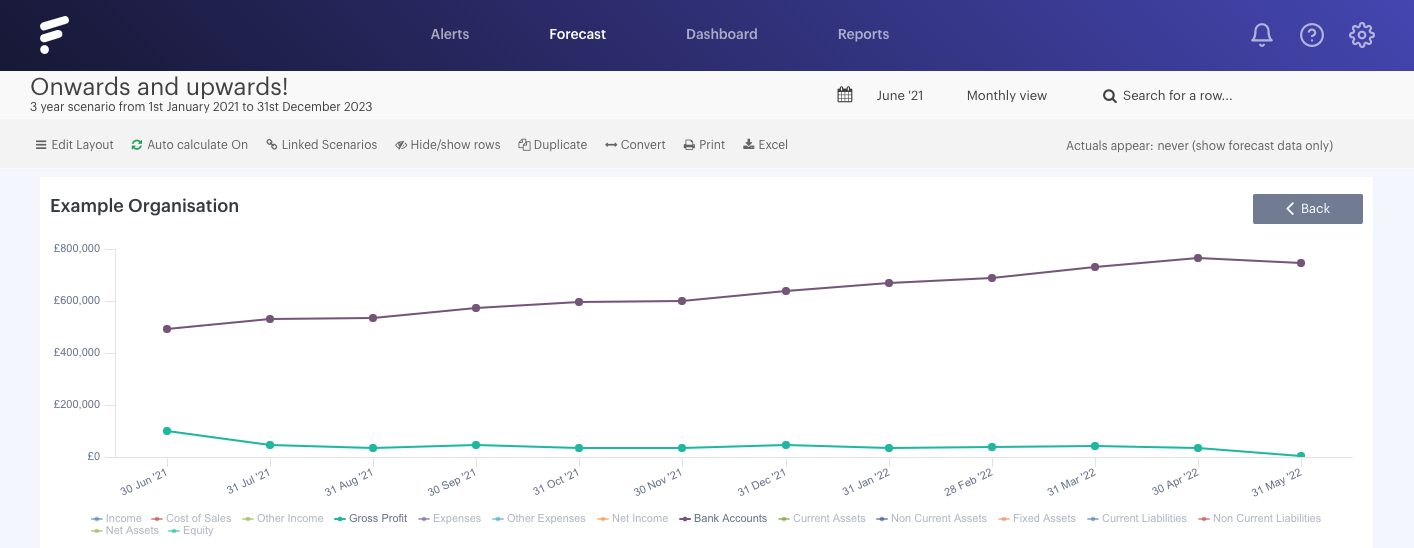
At the top of your forecast you'll find the forecast chart. This offers a visual representation of your actual and forecast data in accordance with your selected view options:
Toggling the display of items on the graph
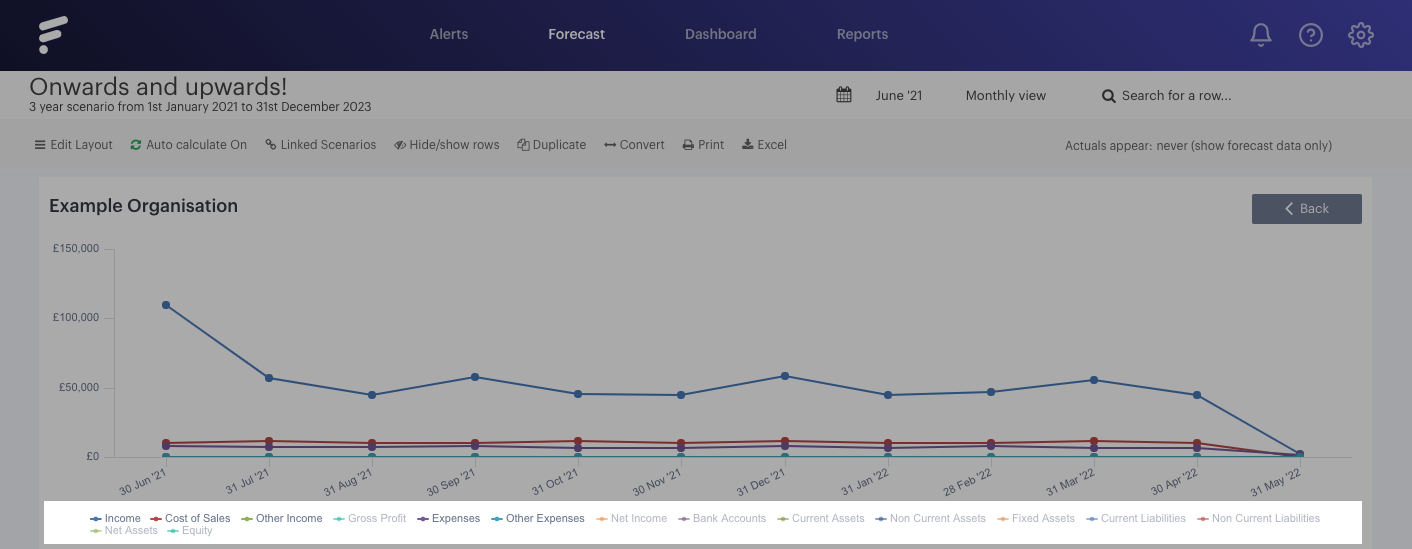
You can toggle items to display on your graph by selecting them from the chart legend:
Searching for items
Using the search bar in the top right of your forecast you can search for account categories, lines, groups, formulas and forecast Items within your forecast.

For more forecasting information, check out the rest of our help guides.

