With annotations, it's easy to add snappy comments to charts and tables within the Printed Reports feature! If what you've got to say is a bit too long for an annotation, we've got you covered with the option to add blocks of text!
- - - - - -
How to add annotations
You can add commentary to your charts and tables with annotations. Use these to reflect on the numbers in your report, add comments for colleagues or simply to discuss the weather. It’s up to you!
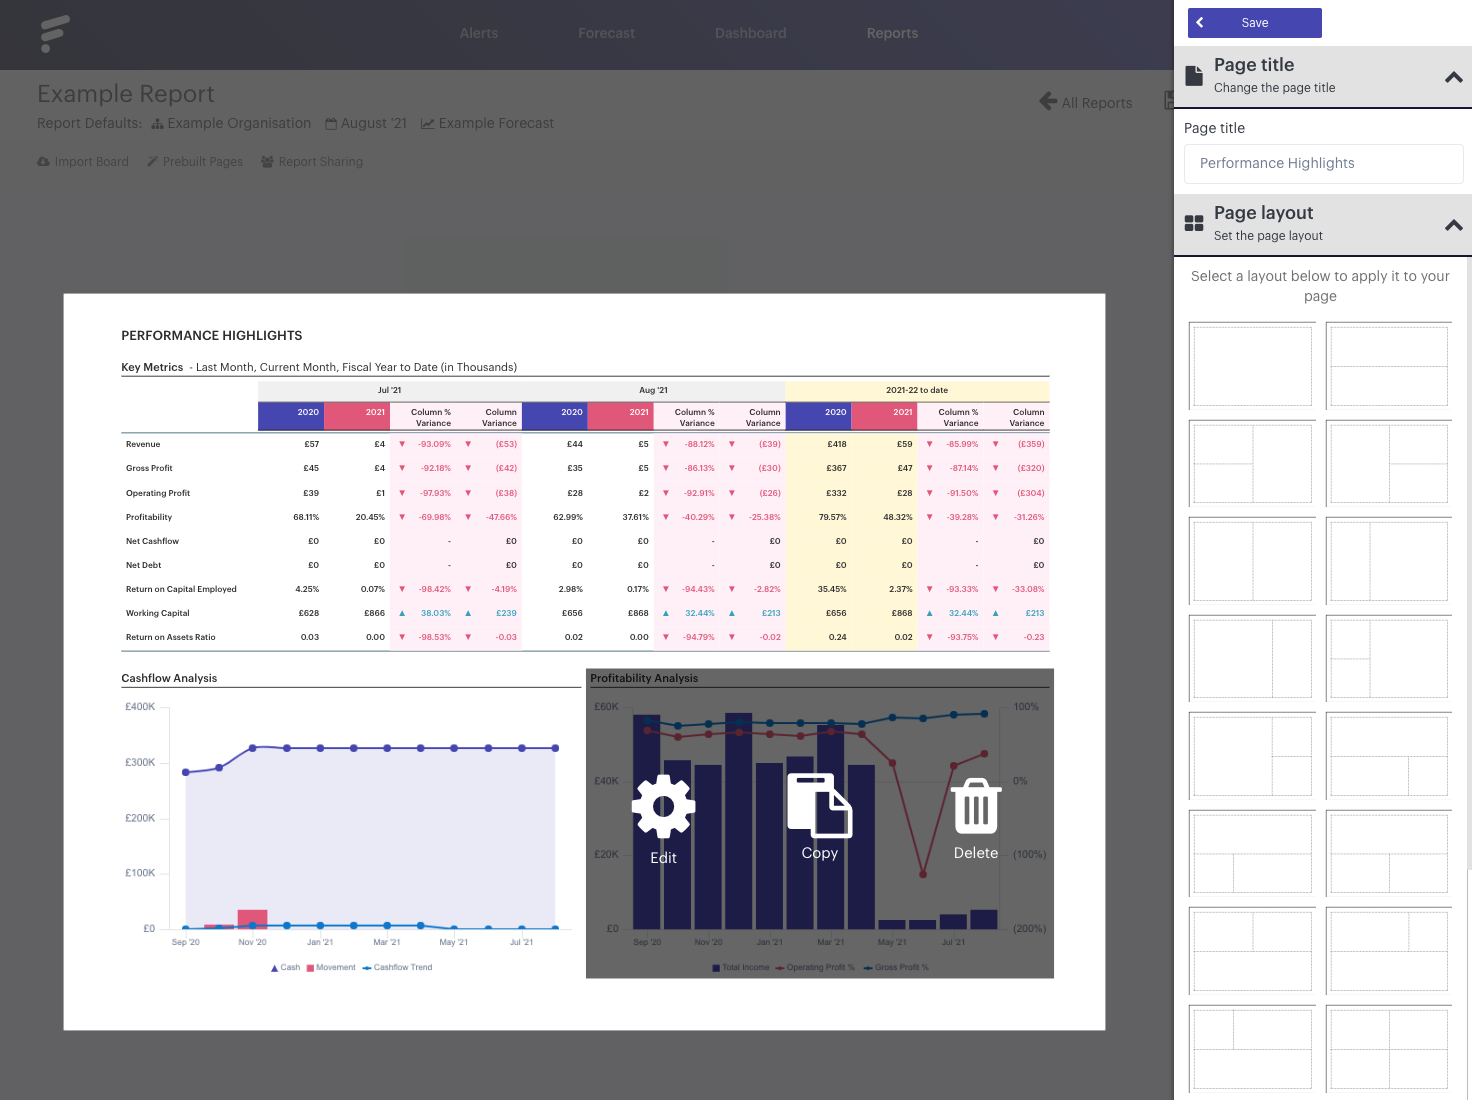
To add commentary, select 'Edit' on the required section:

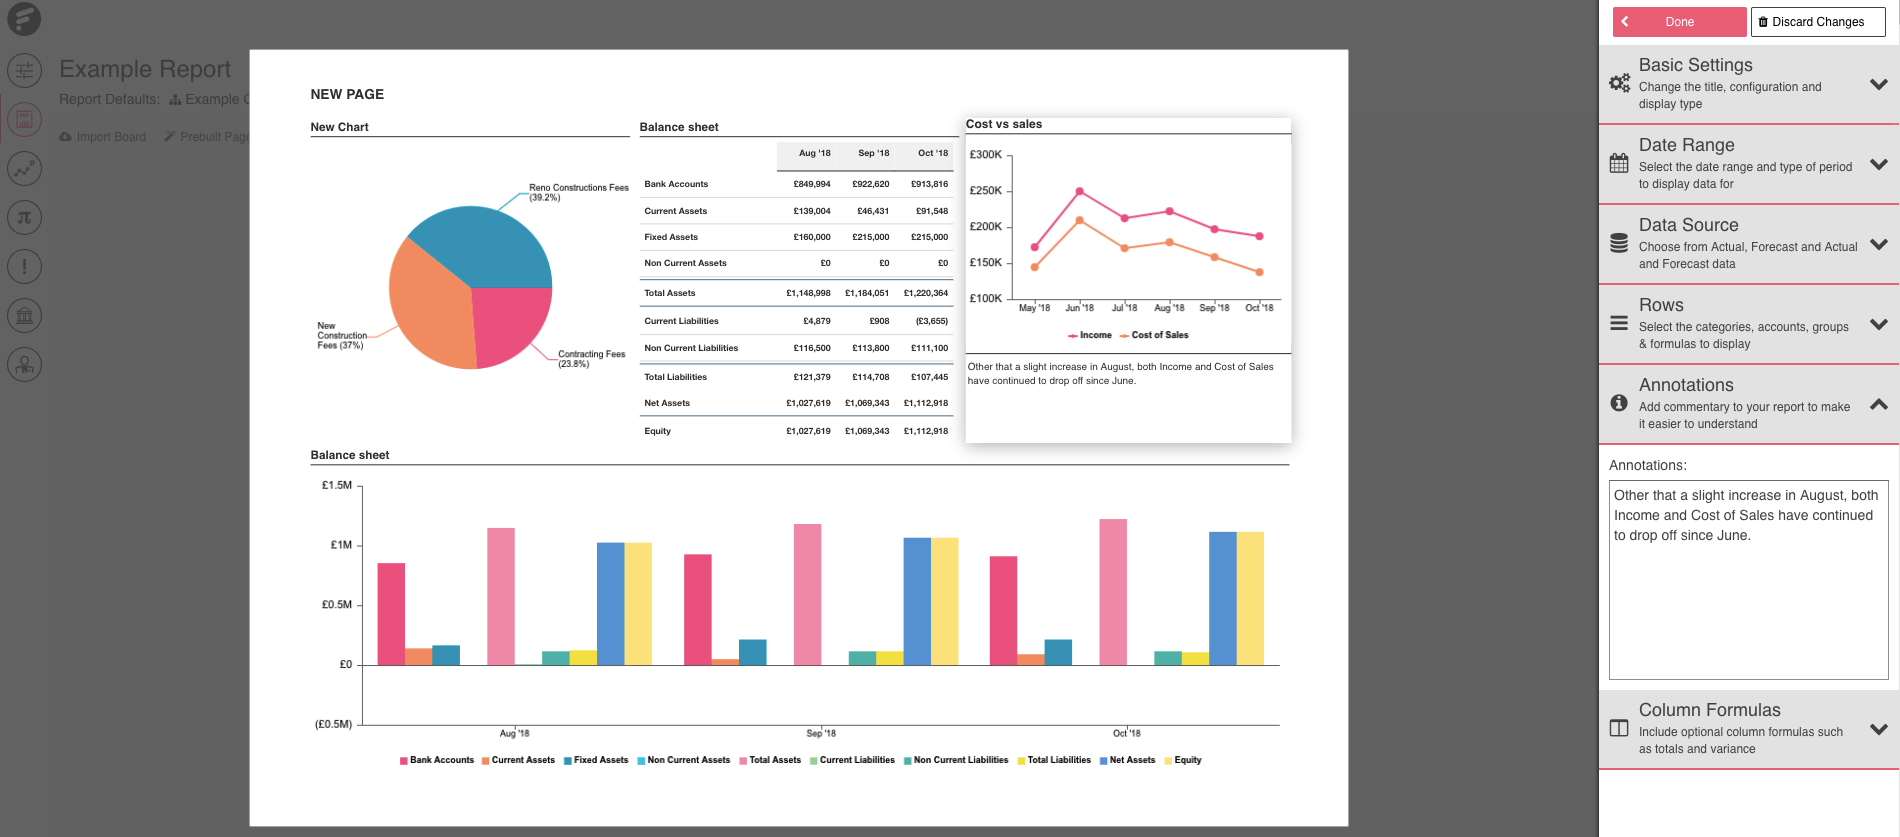
You'll see the 'Annotations' on the right sidebar. Enter your comments in the text box provided, any text you add will appear beneath the appropriate section:

- - - - - -
Formatting text elements
If you’d like to discuss points in more detail then you can do so using a Text Element. This feature allows you to freely add text and images to your report and format the results as you wish. Prefer to use headers or to bolden text? You can!
To add text to a newly created text element, simply select the element and start typing. Use the options in the right side panel to format the text you enter:
- - - - - -
Saving and printing reports
When you’re happy with the report you’ve created, select the 'Save' button in the top right. This will save your progress up to now.
To export the report to PDF so you can print it, ensure you have the appropriate report selected and then click 'Print'.
Once your report has finished generating, we’ll let you know in-app and store a download link for the PDF in your notifications.
