Once a forecast item has been created, you can see a detailed view of how and when the item is impacting upon your accounts by drilling into the data. This can be done by navigating to the account line you wish to examine further and then clicking the period total. This is especially useful for viewing the specific days in which cash and VAT movements are anticipated to occur.
- - - - - -
Step One
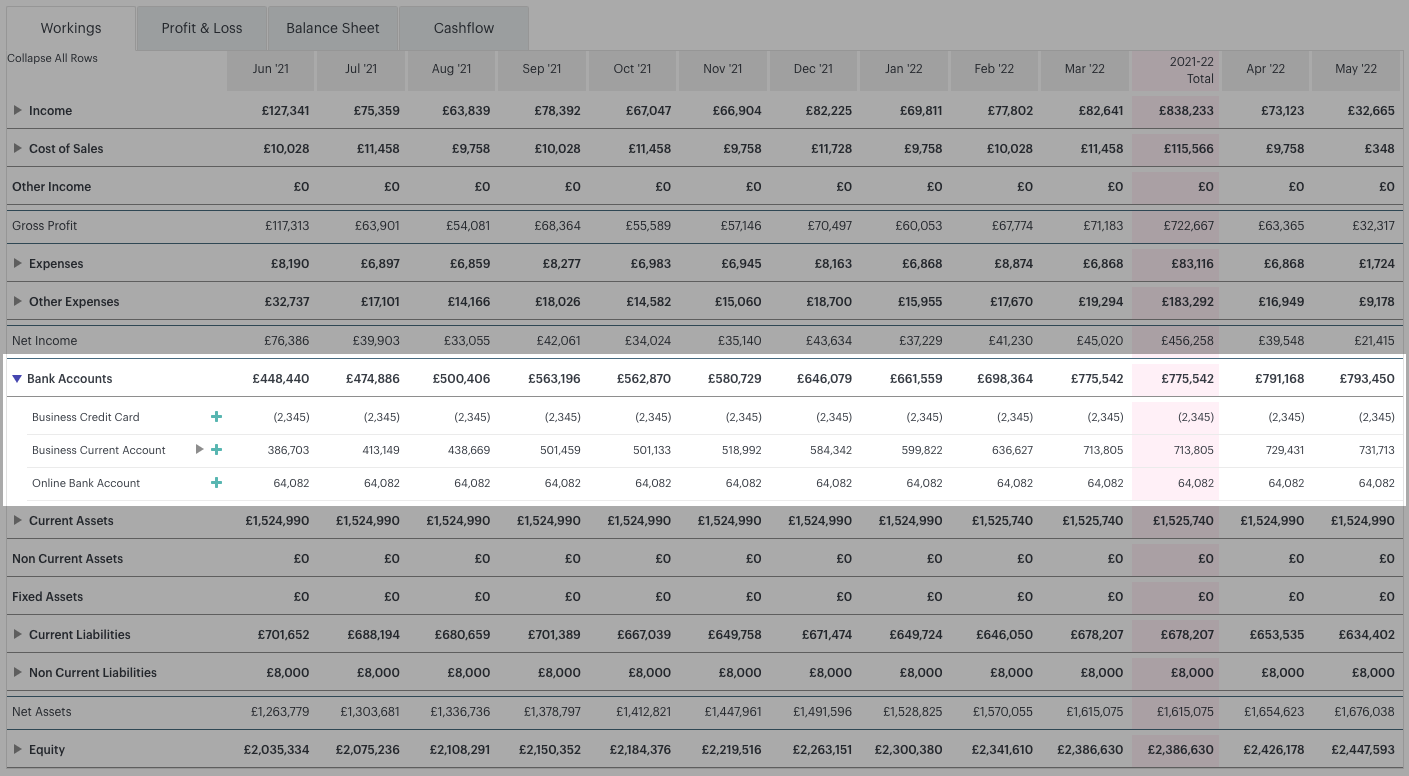
In this example we’re going to drill into our default HSBC Current Account line in order to see a detailed picture of cash movements in and out of our account in December. To do so, we first need to navigate to the line in question:

- - - - - -
Step Two
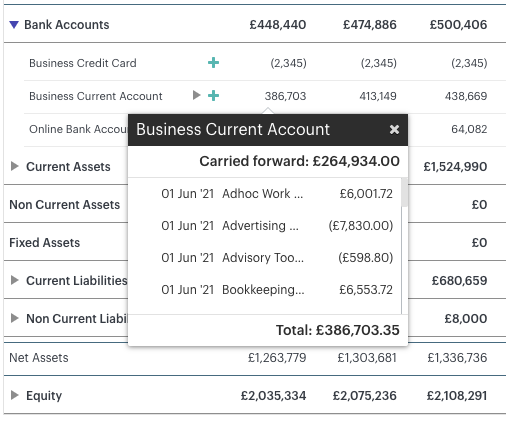
You can now drill into our data for December by clicking the period total. This is the period-end value currently displayed for the month. In this case, 866,204. Clicking the period total exposes a daily breakdown of movements in and out of the account line. You can use the scroll bar to scroll through the transactional detail within the account:

