A forecast will display 12 periods and a financial year total (if you have monthly periods selected). They are functional and give you a focused presentation. However, the real insights come when you present your forecast data in cards.
- - - - - -
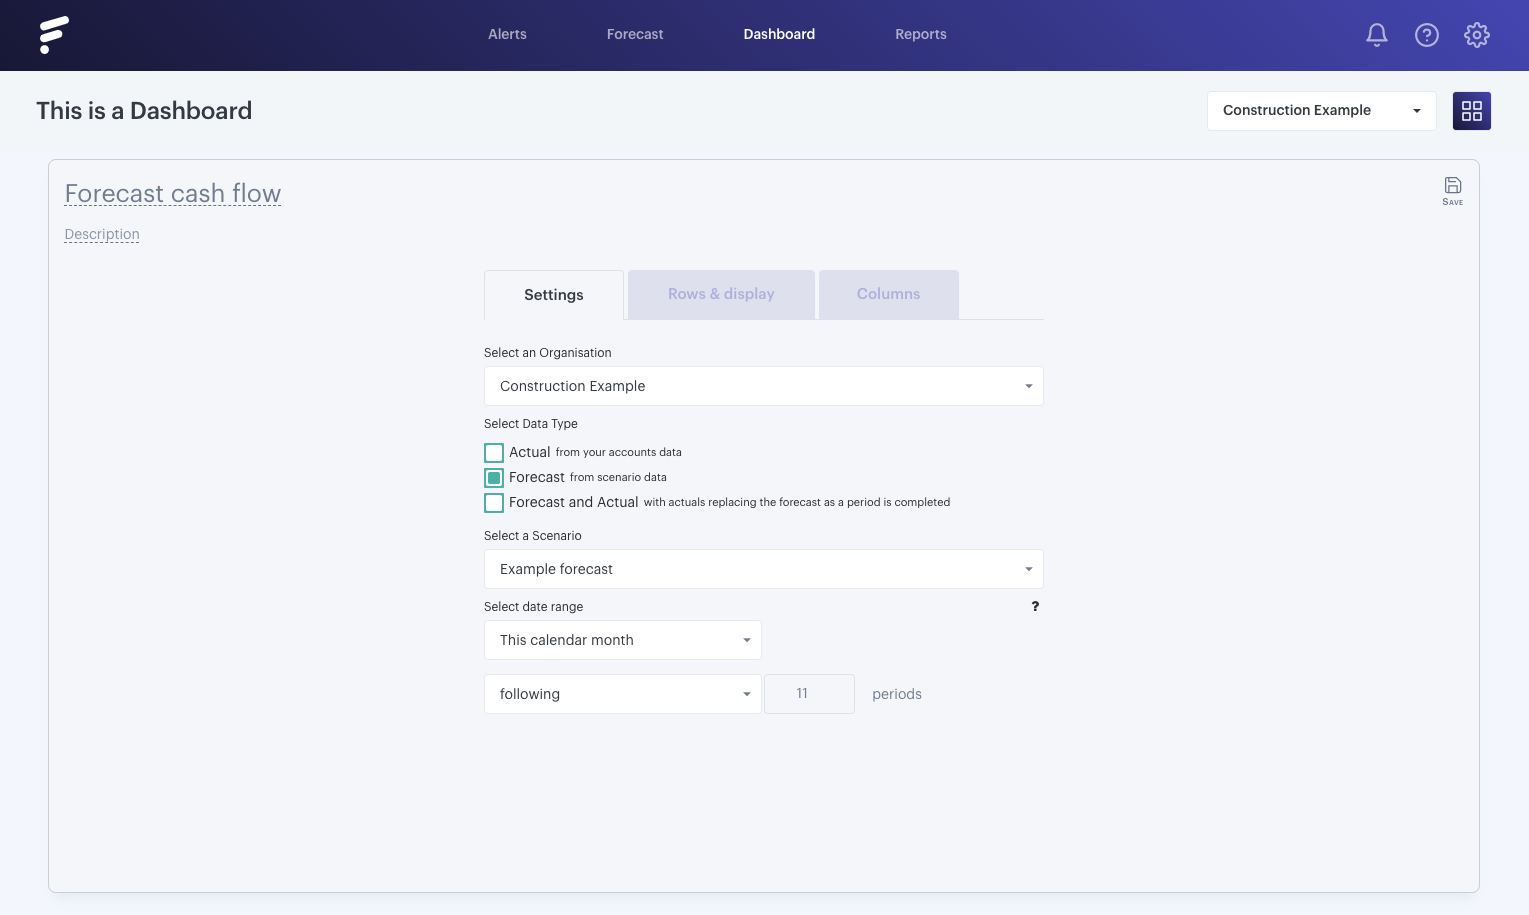
Adding a Forecast cash flow card
Once you've clicked 'New KPI card', you'll find the 'Forecast cash flow' option.
By visualizing in a card (you can, of course, replicate your entire forecast in a board) you can analyze more and highlight areas that you may have missed during the creation of the forecast.
Drill into the forecast items that build up these receipts and payments, check for variances that you might think aren't looking reasonable for your business and visualize your net cashflow vs bank position for instance. Remember you can hit the legends under the chart to focus in on one KPI.
Just ensure that your actuals are showing up until the last period (Settings tab), as your opening balances for your bank need to be accurate.

Please note, we do not pull in the invoices from your online accounting packages and therefore do not have the detail for your actual cash in/cash out. Your financial data shows it in accrual form.
