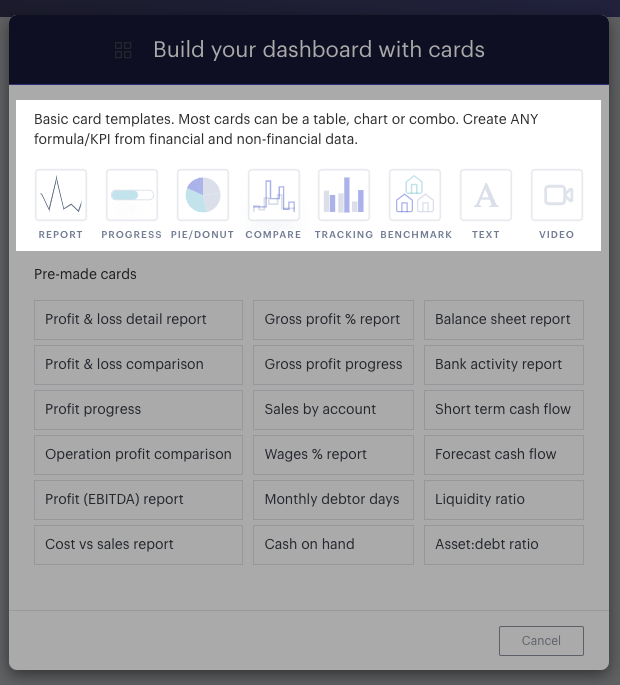
- Basic card templates
- Pre-made cards
Here’s a quick run through of some of the main card types and how they can help.
- - - - - -
Basic card templates
You’ll find the following:

'Report'
The Report card can have one or many of the following appear on it:
- Financial data: Actual, forecast or rolling actual and forecast presentation of your data (you need a forecast created for the last two – you can read about how to build a forecast here)
- Aggregation: As we store all data in its most granular form, you can view it transactionally or cumulatively (P&L data would be transactional and balance sheet data would be cumulative by default)
- Non-financial data: You can import as much non-financial data as you need (more details on uploading non-financial data can be found here)
- Formulas: Any formula you build can be saved to your formula library and can involve financial and non-financial data. They can also reference data in the past and can be used for actual and forecasted data (further details on building formulas can be found here)
'Progress'
A snapshot of where you are today for the period you select for various account categories and high-level formulas. A Progress card will show you 5 crucial metrics that can keep you on track. More detail on Progress cards can be found here.
'Pie/Donut'
Do you want to know which of all of your expenditure you are spending the most on? For this or any other comparison of different proportions within your accounts, the Pie/Donut is your friend.
'Tracking'
If you have departments, regions or sales people and you tag your transactions by using Tracking, this is where you can get granular with the best in this type of reporting!
'Benchmark'
This card will only work for consolidated organizations (further information on how to create a consolidated organization can be found here). This report will let you compare them side-by-side to assess top/worst performers.
'Compare'
This card will help you to monitor your progress today against what you thought you would do in your forecast. This is how you make decisions fast and see if you are near to target and have to adjust business decisions for the remainder of the month.
'Forecast Cashflow'
Payment terms added to forecast items will combine to give you your future cashflow.
'Text'
It is just that! An editable text field which will become invaluable for communication and collaboration when you start sharing live boards with your team/stakeholders/clients/advisor. Make an update and share up-to-date information with your collaborators with one click.
'Video'
Again, because of live boards, lots of our users put their own company content into them with our Video Cards. It’s a great way to communicate with your team in an engaging, relevant way and tie together your insights in an easily digestible presentation for your clients or shareholders.
- - - - - -
Pre-made templates
The pre-made cards section relies on you the creator adjusting the settings. We then have a range of pre-build templates for both P&L and balance sheet accounts that require minimal editing.
- Profit & loss detail report
- Gross profit % report
- Balance sheet report
- Profit & loss comparison
- Gross profit progress
- Bank activity report
- Profit progress
- Sales by account
- Short term cash flow
- Operation profit comparison
- Wages % report
- Forecast cash flow
- Profit (EBITDA) report
- Monthly debtor days
- Liquidity ratio
- Cost vs sales report
- Cash on hand
- Asset:debt ratio
- - - - - -
All of these templates you can make your own, by changing the time periods, data set, the forecast you choose (where relevant), additional formulas or accounts/categories, display options, column formulas etc. Just get in there and have a play, but of course should you need any help our Support Team are on hand to assist with any issues or queries you might encounter!
