Within a forecast, there are a set number of periods that will display at one time. If you were wanting to export all data in one file, you'll need to create cards on a board.
Using a card, you will have full control over the data range that displays and which rows are to be added.
- - - - - -
Exporting the 'Workings' tab
Whilst we have pre-made card templates that can be used to display the P&L, balance sheet and cashflow of your forecast, if you wanted to display the data as per the 'Workings' tab, a 'Report' card will need to be used.
Head into your board and hit 'New KPI card', you can then select the 'Report' option from the list available. You'll then just need to update the settings to show the correct organization, forecast and date range, before adding the rows in question.
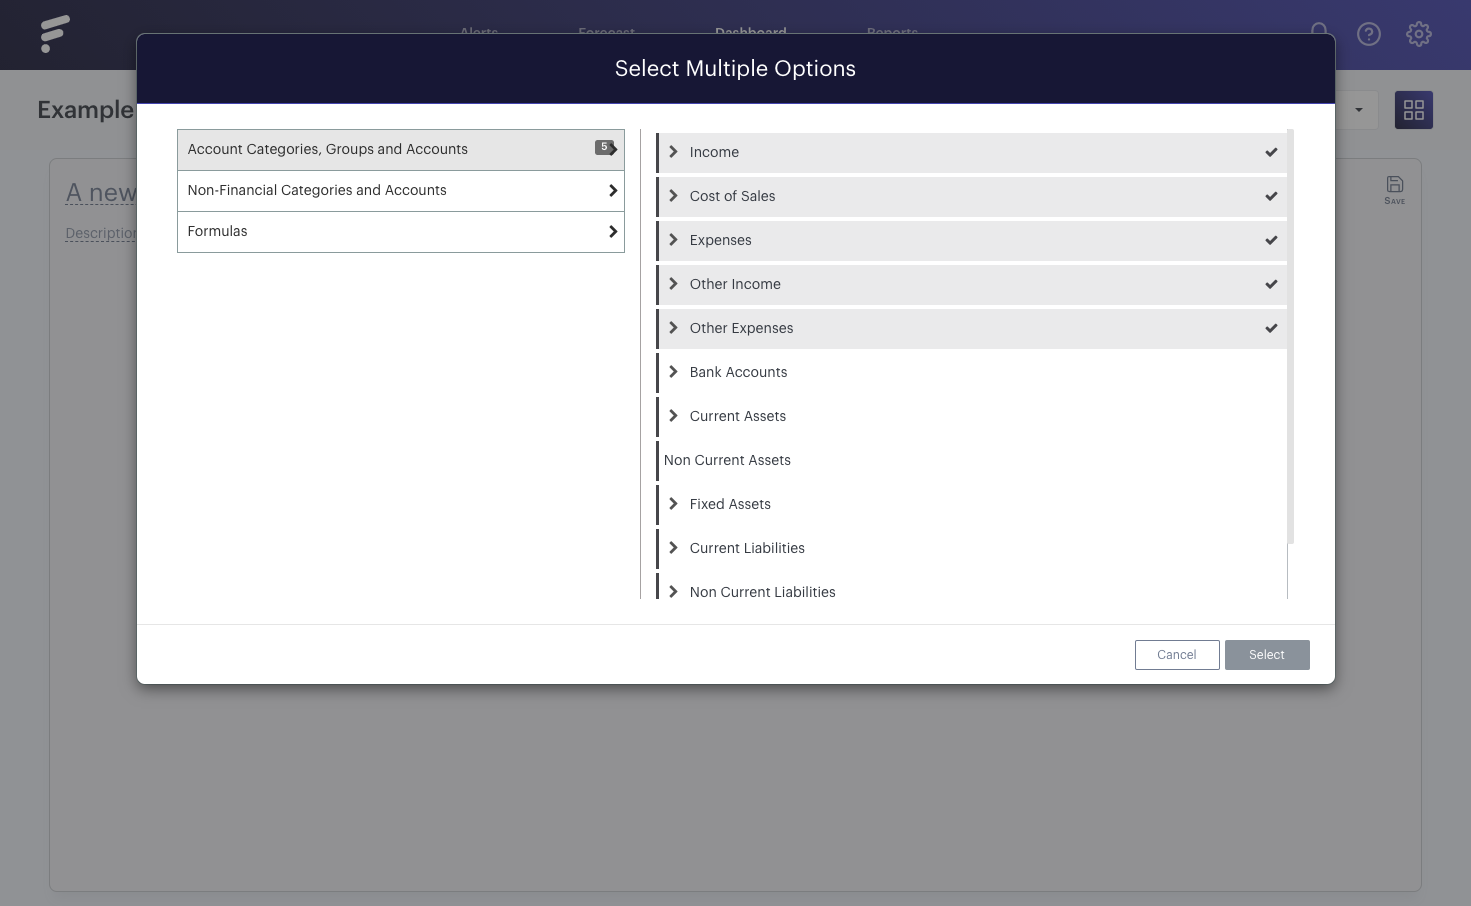
The quickest way to bulk add the rows is to use the option 'See all data'. You can then simply tick the account categories and formulas in question:

- - - - - -
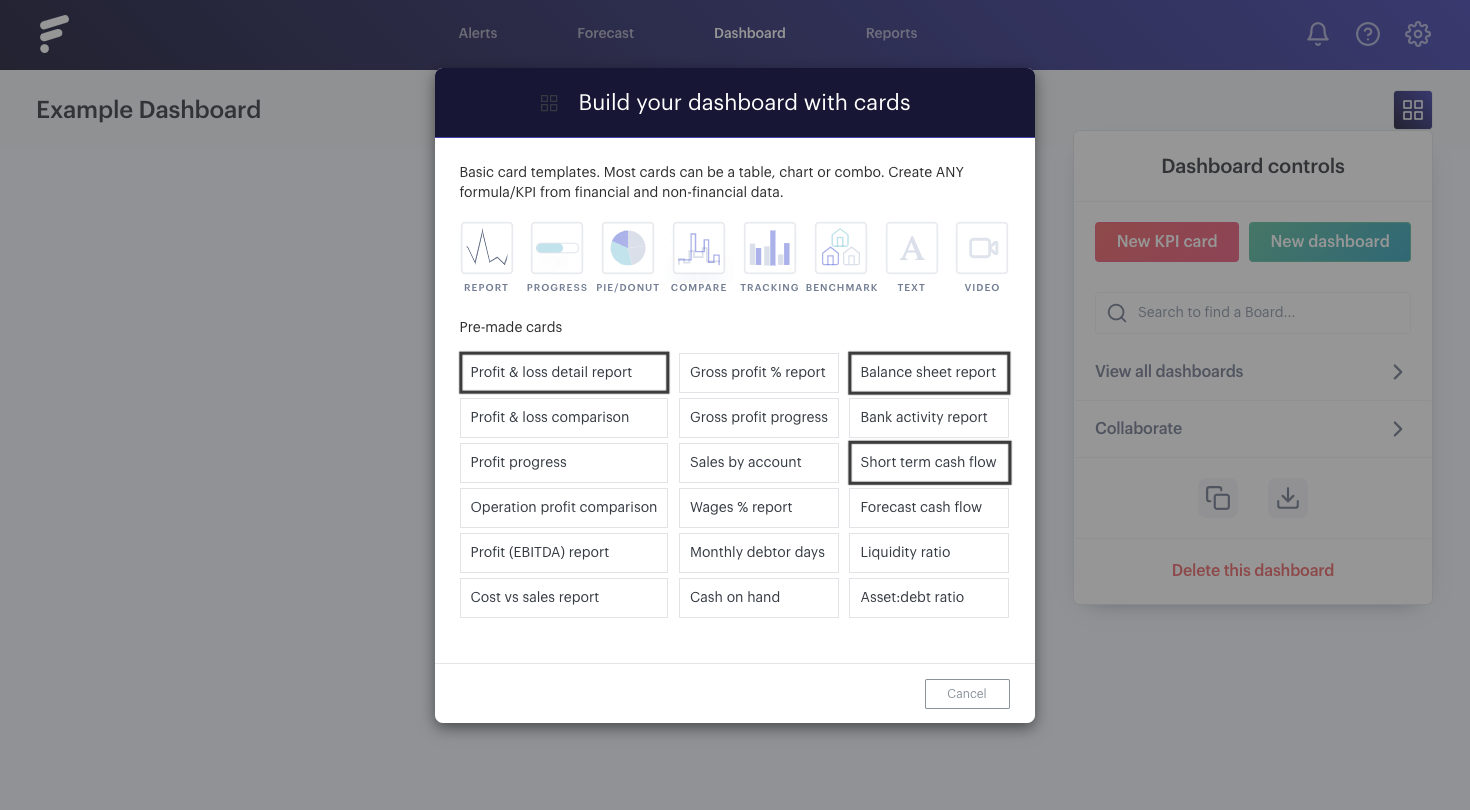
Exporting the 'Profit & Loss', 'Balance Sheet' and 'Cashflow' tabs
With the other three tabs, there are pre-made card templates available to give you a quick and easy way to set the card up with your forecast data. To access any of the three, hit 'New KPI card':

